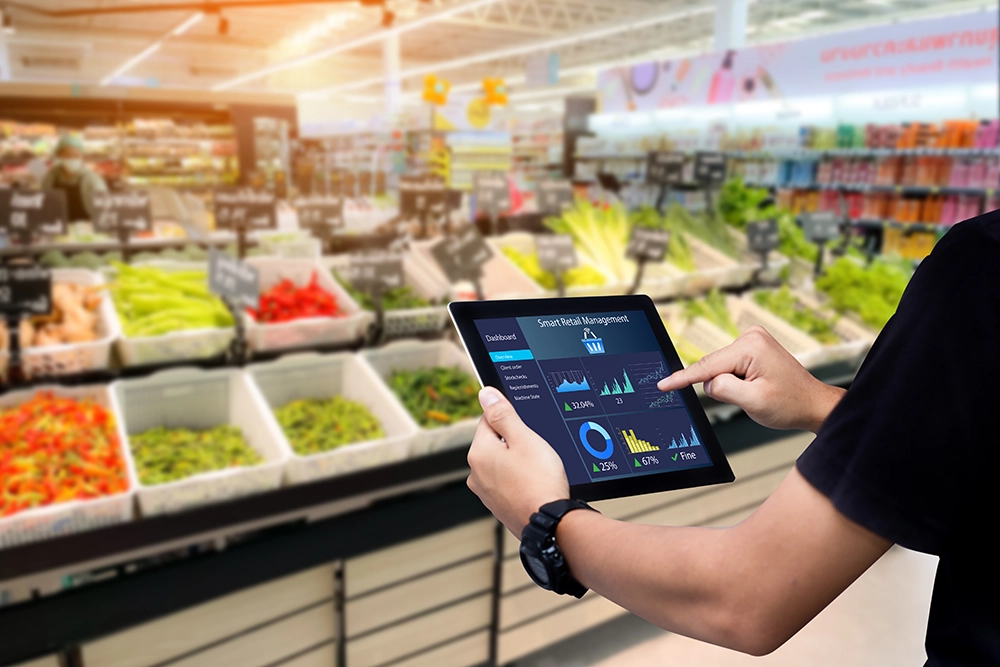
Unleashing retail potential: revolutionising Dutch supermarket analytics for decision making
With the latest technology, Nucleoo provides answers to the customer's main business questions.
Challenge
The retail company had large amounts of purchase ticket data, with more than 100 attributes per item. Processing and analysis in Power BI was very difficult due to the lack of a high-level architecture. In addition, the business questions required more sophisticated analysis, which is not available in general BI tools.
Approach
We first created a big data architecture on AWS, applying Apache Spark, and consolidated all the data from stores, products, supply chains, and so on. At this point, we were able to provide Power BI with a single source of truth for reporting.
In addition, to be able to answer the more complex questions (outside the scope of Power BI) we developed a custom tool with Machine Learning and Python algorithms.
Result
Users can use both Power BI and the custom visualization application developed by Nucleoo to perform advanced analytics autonomously, such as Pareto curves, basket analysis, and anomaly detection. In addition, a COVID-19 crisis planner was developed to calculate future baseline scenarios based on, for example, social distancing, confinements, and mass spot purchases.
Tech involved

AWS

Apache Spark

Jupyter Notebooks

Power BI

Python algorithms
Value added
Nucleoo's big data architecture and custom visualisation application improved the retailer's business intelligence and strategic decision-making, enabling them to stay ahead of the competition.


